Venture Capital Performance over 30 years (US)
Published on 17 May 2020 ⸱ 6 min read ⸱ 36 views

As an asset class, venture capital funds and performance are complicated to understand because of how opaque its operations are. It's one of the few asset classes where the investor can get access to assets in the private market. Nobody other than the fund managers' community really knows exact data on how these funds perform, the funds they've raised, the investors in the fund or even how they select investments. They say it's part science part art.
Recently, I stumbled upon a research paper (can't remember where I found it, most likely it was Twitter) which tries to answer the question of venture capital fund performance. The team that did the research partnered up with Burgiss to use their data for research purposes. Burgiss, from what I understand, provides Venture Capital funds with data and tools to improve investment decisions. Their data includes "Cash Flow and Performance Data On 10,000 Institutional Funds Covering $7.3 trillion in Committed Capital and 70,000 holdings". Sounds legit enough to me to avoid analysing return data from the highest performing funds
The research paper itself covers 30 years of performance data on 46,311 investment holdings as of Q1 CY2019. Holdings includes data on 15,095 buyout investments and 31,206 Venture Capital holdings. Clearly, I'm more interested in the performance data of VC holdings and that's what I'm highlighting below. You can access and read the entire Research Paper here. It's definitely worth a read covering the entire process as well as the results.
Finding 1: VC investments are highly variable and positively skewed
"The median values for VC are well below the mean and even the 75th percentile values fall below the mean, illustrating the highly dispersed and positively skewed distribution of performance."

TVPI is Total Value to Paid in Capital (also known as Multiple on Capital Invested); PME is Public Market Equivalent
"...about half of VC holdings end up being worthless, or with very low value. Roughly 60% of investments lose money. The result is a large gap between mean and median multiples in VC deals.
Such highly dispersed outcomes mean that overall performance in private equity is dependent on the success of a relatively limited number of investments, especially in VC funds."
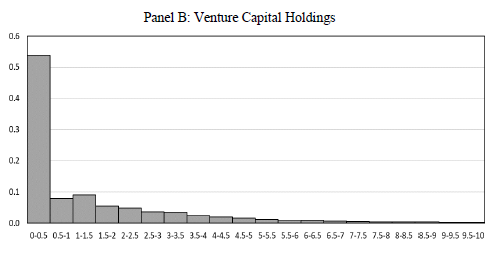
Finding 1: VC investments are highly variable and positively skewed
X-Axis is the TVPI/MoIC and honestly not sure what Y-Axis is
"About 40% of investments end up worthless and the vast majority of value, about 80%, is generated by twenty percent of investments. To use a sports analogy, “hitting home runs” is vitally important to a fund’s success in VC investing"
Finding 2: Large investments appear to have higher performance for venture capital
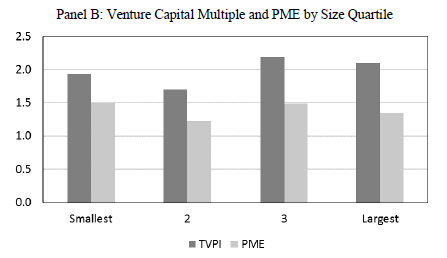
Finding 2: Large investments appear to have higher performance for venture capital
This figure graphs the value-weighted performance for holdings versus the size of the holding. Performance is prior to any fees and carried interest
Finding 3: Average performance of a VC Fund is linked to investment duration; performance peaks at 4 years duration in majority cases, some stretching to 15 years
Average duration of an investment is considered from the date of investment to the date of a realised exit.
"the duration of investments is highly variable, more so in VC. While the median duration is five years ... there is a long “tail” of investments that take much longer more than the typical ten-year assumed life of a PE fund, with a small percent stretching to 15 years or more."
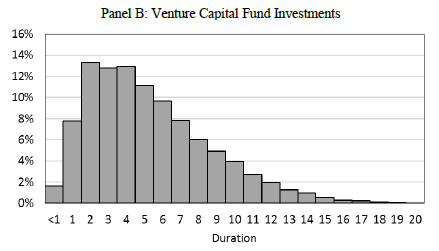
Finding 3: Average performance of a VC Fund is linked to investment duration; performance peaks at 4 years duration in majority cases, some stretching to 15 years
"Average TVPIs trend up slightly with duration while average PMEs hold steady above 1.0. This pattern in VC may reflect the sequential nature of financing as well as the heterogeneity of holdings within the venture space and the longer time it takes to build a young company."

Finding 4: Performance is lower for investments made (holdings) in years when the supply of capital to the sector is high
"...the performance effects of capital supply are more pronounced and appear most strongly related to the investment year of the holding. Average performance of VC investments made in years with high capital supply are noticeably lower."

Read this as "Return multiples (Y-Axis) are lowest when there is a lot of available capital in the market (high) during a certain period"
A note on how this was calculated: "(this figure) charts investment multiples based on the amount of capital available to do deals. We use funds committed, but not yet called, across all funds, or so-called “dry powder”, as our measure of available capital. We do this for ... VC funds and divide by the trailing three-year average of dry powder. Years are then segmented into quartiles (4 being high levels of dry powder) using three alternate schemes: the vintage year of a fund making an investment (first cluster of 4 bars), the year the investment is made (second cluster of bars) and the year the holding is exited"
Conclusion: "...many (VC) investments turn out worthless and average performance is boosted by some spectacular successes that create the bulk of fund value. Performance appears linked to a number of factors (including investment size, duration of the investment and levels of fund raising)..."
This data-backed approach to analysing VC performance really caught my attention. The industry has always known these findings intuitively, but having data to back it up makes it conclusive, IMO. Would also recommend reading through the Appendix section which has a lot more detailed statistics and analyses.
All credits to Gregory Brown, Robert S. Harris, Wendy Hu, Tim Jenkinson, Steven N. Kaplan, and David Robinson, the authors of the paper. Here's a link to the research paper, again.
Let me know what you think of this research paper. Are there certain aspects you've not fully understood? I'm also keen to learn your experience with VC funds and its performance.
Onward.
Note: All blogs posts till 2022 were migrated to this platform (react+next+tailwind). While all efforts were made to migrate wihtout any loss, the migration lost some images and broke a bunch of links in old posts. If you spot anything amiss, please notify me?